How It Works
Instant Remodeling Cost Estimates, Localized to Your ZIP Code
Most cost calculators show you a national average and call it a day. We pull from four public data sources to build an estimate that's actually local. Construction wages in your metro area, home value data for your ZIP, regional ROI figures from the annual Cost vs. Value report, and contractor demand patterns for the current month. Free, in seconds, no account needed.
Three steps to your estimate
No forms, no wait, no sales calls. Your estimate is ready in under 10 seconds.
Enter any US ZIP code
Type in any ZIP code across all 50 states. Every estimate is specific to your market. Not your state's average. Not the national average. Yours.
Choose a project
Pick from ten common home improvement projects: kitchen remodel, bathroom remodel, roofing, windows, garage door, deck addition, basement finishing, siding, entry door, or HVAC.
Get your estimate + ROI score
You'll see a cost range adjusted to your local market, plus an ROI score showing how much you can expect to recoup at resale. Costs factor in actual construction wages for your area and local home value data. ROI uses regional recoup rates from the Cost vs. Value report, not a single national number.
Ten projects. Any ZIP code in the US.
Ten projects, 26,000+ ZIP codes, all 50 states. Same methodology for all of them.
Kitchen Remodel
Minor midrange remodel: new cabinet fronts, countertops, flooring, and fixtures. High visibility, strong resale impact.
Typical range: $22k - $35k
Bathroom Remodel
Midrange update: new tile, vanity, tub/shower, and lighting. One of the most-searched remodeling cost questions.
Typical range: $20k - $32k
Roofing Replacement
Full asphalt shingle replacement. Strong ROI, clear payback story, and a necessity most homeowners face every 20-25 years.
Typical range: $9k - $18k
Window Replacement
10-window vinyl replacement. Improves energy efficiency, curb appeal, and resale value in one project.
Typical range: $12k - $20k
Garage Door Replacement
Full steel garage door replacement. Consistently the highest-ROI exterior project, often exceeding 100% recouped.
Typical range: $3.5k - $6k
Deck Addition
New wood or composite deck addition. Extends usable living space and adds strong outdoor appeal for buyers.
Typical range: $14k - $22k
Basement Finishing
Converting unfinished basement to livable space. High-dollar project with solid return in most markets.
Typical range: $46k - $72k
Siding Replacement
Full fiber-cement siding replacement. One of the best exterior investments for curb appeal and resale value.
Typical range: $14k - $22k
Entry Door Replacement
Steel entry door replacement. Low cost, massive ROI. Among the best bang-for-buck projects in the Cost vs. Value report.
Typical range: $1.9k - $3k
HVAC Replacement
Full HVAC system replacement. A necessity in most climates. Know the cost before you're forced to replace in an emergency.
Typical range: $8k - $13k
Ranges shown are national midrange estimates. Enter your ZIP code to see costs adjusted to your local market.
Four data sources, all public
We're not going to pretend we have some secret sauce. Everything we use is public data. Here's what it is and where it comes from.
-
Remodeling Magazine Cost vs. Value Report 2025 edition
This is the industry benchmark. Published every January, it covers what midrange remodeling projects actually cost and how much you get back at resale, broken down by 9 US Census regions. A kitchen remodel recoups a very different percentage in Seattle than in Memphis. We use the regional numbers, not the national average. That's where our ROI scores come from.
-
BLS Occupational Employment and Wage Statistics May 2024
The US Bureau of Labor Statistics publishes actual construction worker wages for hundreds of metro areas twice a year. We use this to set the labor cost component of each estimate. A roofing crew in Chicago costs more per hour than one in rural Alabama. That's a fact, and it's in the data. Using home values as a proxy for labor costs (what most calculators do) breaks down pretty badly in resort towns and agricultural markets, which is why we don't do that.
-
Zillow Home Value Index updated annually
ZIP-level median home values, used to adjust the materials portion of each estimate. Things like lumber, fixtures, and equipment don't vary as dramatically as labor does by geography, but they do track loosely with local market values. So we use Zillow data for that component and BLS wages for the labor component. It's a more accurate split than treating them the same.
-
Contractor demand patterns evergreen
Contractor pricing isn't flat year-round. Roofers in Minnesota are booked solid every April. HVAC crews get slammed in July and February. The estimate you see reflects what the market looks like right now, in your climate, for this project type. Booking lead times adjust too. The underlying base cost is always shown so you can see what changes.


How the estimate is built
Four steps, in order. Each one uses a different data source.
- 1
Start with the national base cost
Each project has a national midrange baseline from the Cost vs. Value report. That's the starting point. What you actually pay in your market will be higher or lower based on the next steps.
- 2
Adjust for your local market
This is where most calculators cut corners. We adjust labor and materials costs separately, because they don't move together. Labor costs track construction wages in your metro area (from BLS data). Materials track local home values. How much each factor weighs depends on the project type. An HVAC install is mostly labor. A roofing job is more materials. We weight them accordingly.
- 3
Factor in the current season
The same project costs more in peak season than off-season. Roofers in cold climates book out 6-8 weeks every spring. HVAC crews are slammed in July. We adjust the estimate based on the current month and your climate zone. The base range is always shown so you can see what changes seasonally and what doesn't.
- 4
Calculate ROI for your region
ROI isn't national. How much you recoup at resale depends on where you live. We use the regional breakdown from Cost vs. Value, which covers 9 US Census regions. The number shown is specific to your part of the country. And the dollar value a project adds to your home doesn't change based on when you hired. Only what you paid does. So ROI shifts with the season.
How fresh is the data?
Project costs
Cost vs. Value
2025Regional ROI rates
Cost vs. Value
2025Labor wages
BLS OEWS
May 2024Home values by ZIP
Zillow ZHVI
AnnualSeasonal patterns
Internal model
EvergreenGood enough to walk into a contractor meeting
We're not trying to replace a contractor quote. We're trying to make sure you're not starting from zero when you get one. Know the ballpark before you ask. Know when a number sounds off.
26,000+
US ZIP codes with localized cost data
±15%
Typical accuracy vs. real contractor quotes
10
Projects covered with full ROI analysis
0
Accounts, sign-ups, or sales calls required
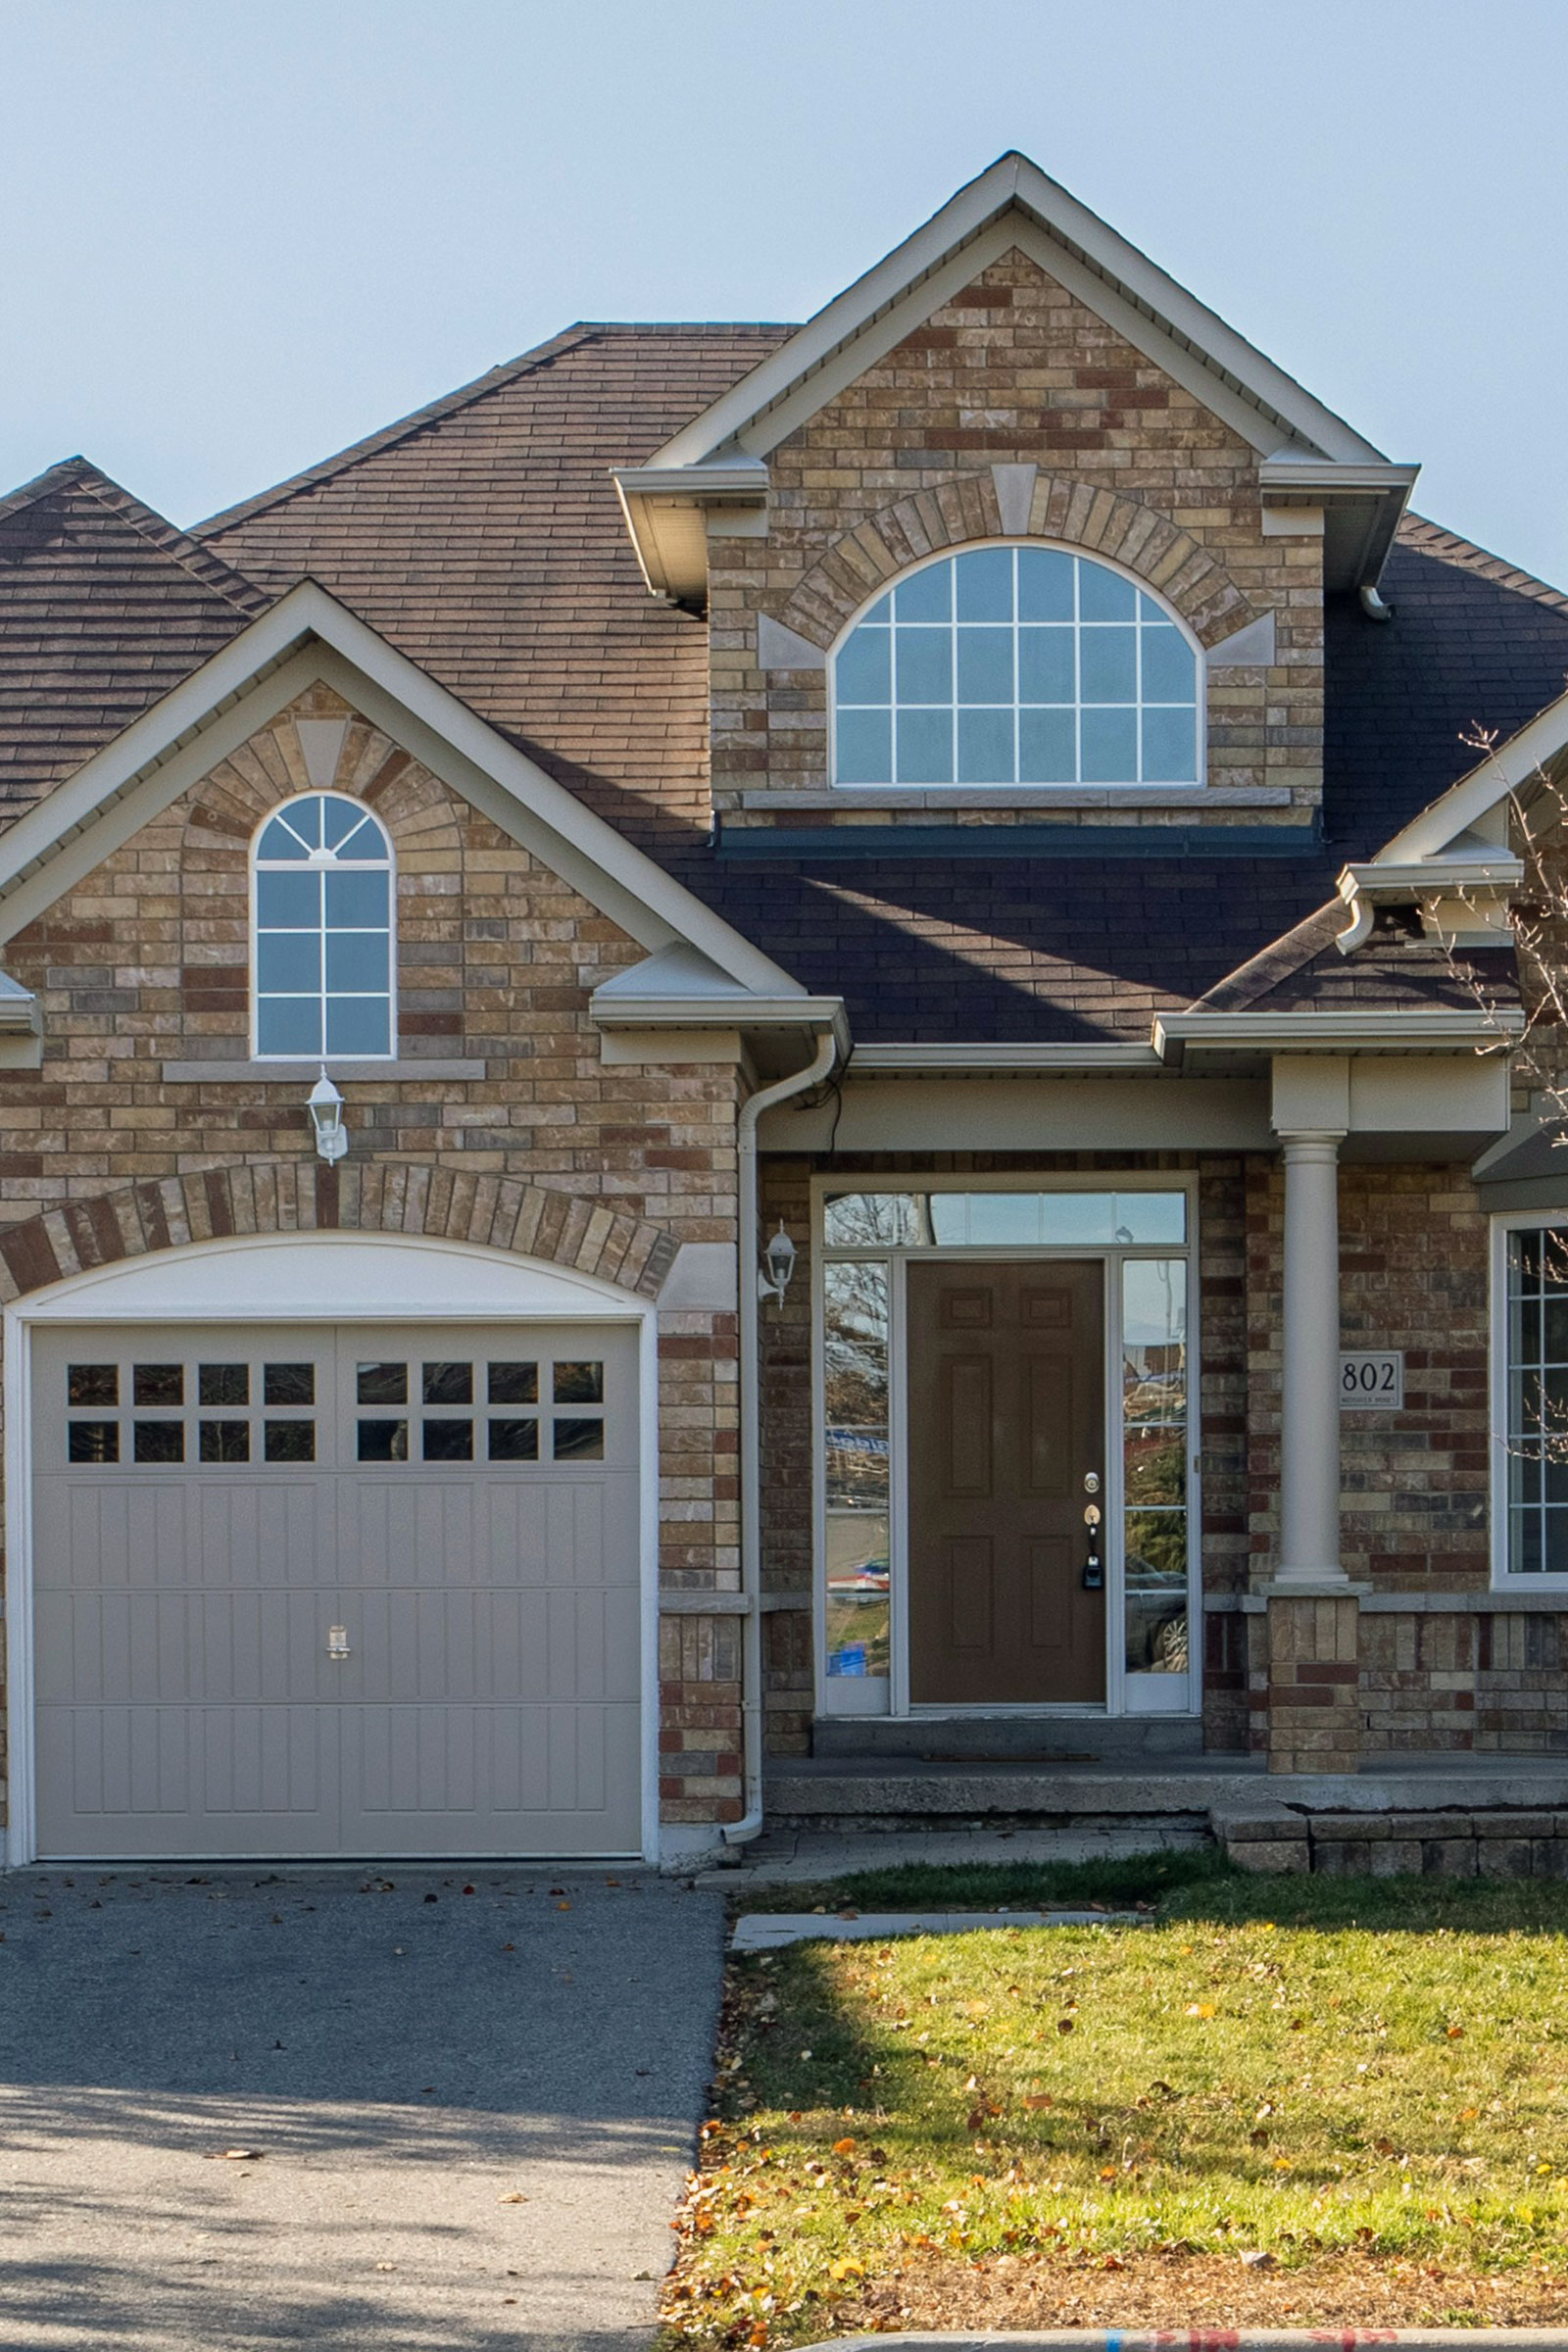
Who actually uses this
Mostly homeowners who are somewhere in the planning phase. Not ready to call contractors yet, but past the "I wonder what this costs" stage.
- You want to know if a quote you got is in the right range
- You're deciding between two projects and need to compare ROI before committing
- You're selling in the next year and trying to figure out what's worth doing
- You want to have an informed conversation with a contractor instead of just nodding along
- You moved somewhere new and have no idea what things cost in your market
Still have questions?
The FAQ goes deeper on methodology, data sources, and what the estimates are and aren't good for.